Returns a vector of raster cell numbers extracted at the locations of a spatial object.
anchor.svo(
  r,
  dsn,
  only_NAs = FALSE,
  fill_NAs = FALSE,
  plot = FALSE,
  saveRDS = NULL,
  writeRaster = NULL,
  overWrite = FALSE
)
Arguments
- r
single or multi-layer raster of the class
SpatRaster(seehelp("rast", terra)).- dsn
data source name (filename) or an
sf, aSpatialor aSpatVectorobject.- only_NAs
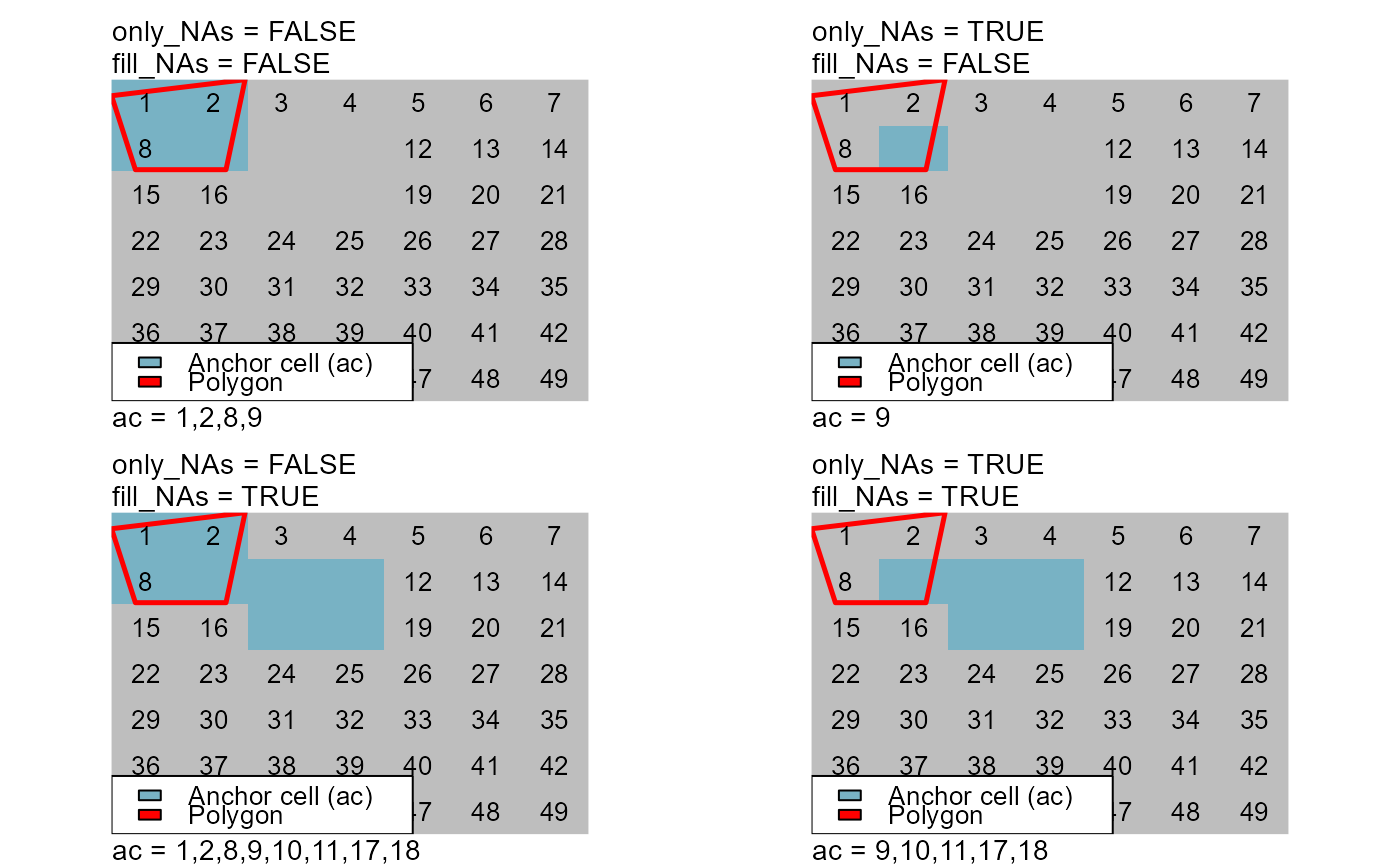
logic, cell numbers extracted only for incomplete cases at the locations of a spatial object. Incomplete cases are cells having an NA-value in one or more layers of the raster object.
- fill_NAs
logic, cell numbers extracted at the locations of a spatial object and at contiguous locations that are incomplete cases.
- plot
logic, plot anchor cells.
- saveRDS
filename, if a file name is provided save the anchor cell vector as an RDS file.
- writeRaster
filename, if a raster name is provided save the anchor cell vector as a raster file.
- overWrite
logic, if RDS and raster names already exist, existing files are overwritten.
Value
Numeric vector of raster cell numbers.
Details
When the arguments only_NA and fill_NAs are FALSE the
numeric output is equivalent to the output of the function
terra::extract(r, dsn, cells = TRUE)[["cell"]].
Examples
# DUMMY DATA
################################################################################
# LOAD LIBRARIES AND DATA
library(scapesClassification)
library(terra)

# CELL NUMBERS OF A DUMMY RASTER (7X7)
r_cn <- terra::rast(matrix(1:49, nrow = 7, byrow = TRUE), extent=c(0,1,0,1))

# SET SOME NA-VALUE
r_cn[c(9, 10, 11, 17, 18)] <- NA

# BULD A DUMMY POLYGON
pol <- rbind(c(0,0.95), c(0.28,1), c(0.24, 0.72), c(0.05,0.72), c(0,0.95))
pol <- terra::vect(pol, type="polygons")
################################################################################

################################################################################
# ANCHOR.SVO
################################################################################
ac1 <- anchor.svo(r_cn, pol, only_NAs = FALSE, fill_NAs = FALSE)
ac2 <- anchor.svo(r_cn, pol, only_NAs = TRUE,  fill_NAs = FALSE)
ac3 <- anchor.svo(r_cn, pol, only_NAs = FALSE, fill_NAs = TRUE)
ac4 <- anchor.svo(r_cn, pol, only_NAs = TRUE,  fill_NAs = TRUE)

# RASTER CELL NUMBERS 2 RASTER
r1 <- r_cn; r1[] <- NA; r1[ac1] <- 1
r2 <- r_cn; r2[] <- NA; r2[ac2] <- 1
r3 <- r_cn; r3[] <- NA; r3[ac3] <- 1
r4 <- r_cn; r4[] <- NA; r4[ac4] <- 1
################################################################################

################################################################################
# PLOTS
################################################################################
oldpar <- par(mfrow = c(2,2))
m = c(1, 3.5, 2.5, 3.5)

# 1)
plot(r1, type="classes", col="#78b2c4", colNA="grey", axes=FALSE, legend=FALSE, asp=NA, mar=m)
plot(pol, add = TRUE, lwd = 2.5, border = "red")
text(r_cn)
mtext(side=3, line=1, cex=0.9, adj=0, "only_NAs = FALSE")
mtext(side=3, line=0, cex=0.9, adj=0, "fill_NAs = FALSE")
ac1 <- paste("ac =", paste0(sort(ac1), collapse = ","))
mtext(side=1, line=0, cex=0.9, adj=0, ac1)
legend("bottomleft", ncol = 1, bg = "white",
       legend = c("Anchor cell (ac)", "Polygon"), fill = c("#78b2c4", "red"))

# 2)
plot(r2, type="classes", col="#78b2c4", colNA="grey", axes=FALSE,legend=FALSE, asp=NA, mar=m)
plot(pol, add = TRUE, lwd = 2.5, border = "red")
text(r_cn)
mtext(side=3, line=1, cex=0.9, adj=0, "only_NAs = TRUE")
mtext(side=3, line=0, cex=0.9, adj=0, "fill_NAs = FALSE")
ac2 <- paste("ac =", paste0(sort(ac2), collapse = ","))
mtext(side=1, line=0, cex=0.9, adj=0, ac2)
legend("bottomleft", ncol = 1, bg = "white",
       legend = c("Anchor cell (ac)", "Polygon"), fill = c("#78b2c4", "red"))

# 3)
plot(r3, type="classes", col="#78b2c4", colNA="grey", axes=FALSE, legend=FALSE, asp=NA, mar=m)
plot(pol, add = TRUE, lwd = 2.5, border = "red")
text(r_cn)
mtext(side=3, line=1, cex=0.9, adj=0, "only_NAs = FALSE")
mtext(side=3, line=0, cex=0.9, adj=0, "fill_NAs = TRUE")
ac3 <- paste("ac =", paste0(sort(ac3), collapse = ","))
mtext(side=1, line=0, cex=0.9, adj=0, ac3)
legend("bottomleft", ncol = 1, bg = "white",
       legend = c("Anchor cell (ac)", "Polygon"), fill = c("#78b2c4", "red"))

# 4)
plot(r4, type="classes", col="#78b2c4", colNA="grey", axes=FALSE, legend=FALSE, asp=NA, mar=m)
plot(pol, add = TRUE, lwd = 2.5, border = "red")
text(r_cn)
mtext(side=3, line=1, cex=0.9, adj=0, "only_NAs = TRUE")
mtext(side=3, line=0, cex=0.9, adj=0, "fill_NAs = TRUE")
ac4 <- paste("ac =", paste0(sort(ac4), collapse = ","))
mtext(side=1, line=0, cex=0.9, adj=0, ac4)
legend("bottomleft", ncol = 1, bg = "white",
       legend = c("Anchor cell (ac)", "Polygon"), fill = c("#78b2c4", "red"))

par(oldpar)