Evaluate conditions for cells neighboring specific classes and classify them if conditions are true.
cond.4.nofn(
  attTbl,
  ngbList,
  rNumb = FALSE,
  classVector,
  class,
  nbs_of,
  cond,
  min.bord = NULL,
  max.iter = +Inf,
  peval = 1,
  directional = FALSE,
  ovw_class = FALSE,
  hgrowth = FALSE
)
Arguments
- attTbl
data.frame, the attribute table returned by the function
attTbl.- ngbList
list, the list of neighborhoods returned by the function
ngbList.- rNumb
logic, the neighborhoods of the argument
ngbListare identified by cell numbers (rNumb=FALSE) or by row numbers (rNumb=TRUE) (seengbList). It is advised to use row numbers for large rasters.- classVector
numeric vector, defines the cells in the attribute table that have already been classified. See
conditionsfor more information about class vectors.- class
numeric, the classification number to assign to all cells that meet the function conditions.
- nbs_of
numeric or numeric vector, indicates the class(es) of focal and anchor cells. Conditions are only evaluated at positions adjacent to anchor and focal cells. If the classification number assigned with the argument
classis also included in the argumentnbs_of, the function takes into account class continuity (seeconditions).- cond
character string, the conditions a cell have to meet to be classified as indicated by the argument
class. The classification number is only assigned to unclassified cells unless the argumentovw_class = TRUE. Seeconditionsfor more details.- min.bord
numeric value between 0 and 1. A test cell is classified if conditions are true and if among its bordering cells a percentage equal or greater than
min.bordbelong to one of the classes ofnbs_of. Percentages are computed counting only valid neighbors (i.e., neighbors with complete cases).- max.iter
integer, the maximum number of iterations.
- peval
numeric value between 0 and 1. If absolute or relative neighborhood conditions are considered, test cells are classified if the number of positive evaluations is equal or greater than the percentage specified by the argument
peval(seeconditions).- directional
logic, absolute or relative neighborhood conditions are tested using the directional neighborhood (see
conditions).- ovw_class
logic, reclassify cells that were already classified and that meet the function conditions.
- hgrowth
logic, if true the classes in
nbs_ofare treated as discrete raster objects and the argumentclassis ignored.
Value
Update classVector with the new cells that were classified by
the function. See conditions for more details about class
vectors.
Details
The function evaluates the conditions of the argument
condfor all unclassified cells in the neighborhood of focal and anchor cells (specified by the argumentnbs_of). Unclassified cells are NA-cells inclassVector.Cells that meet the function conditions are classified as indicted by the argument
class.Class continuity is considered if the classification number assigned with the argument
classis also included in the argumentnbs_of. This means that, at each iteration, newly classified cells become focal cells and conditions are tested in their neighborhood.All types of conditions can be used. The condition string can only include one neighborhood condition (
'{}') (seeconditions).
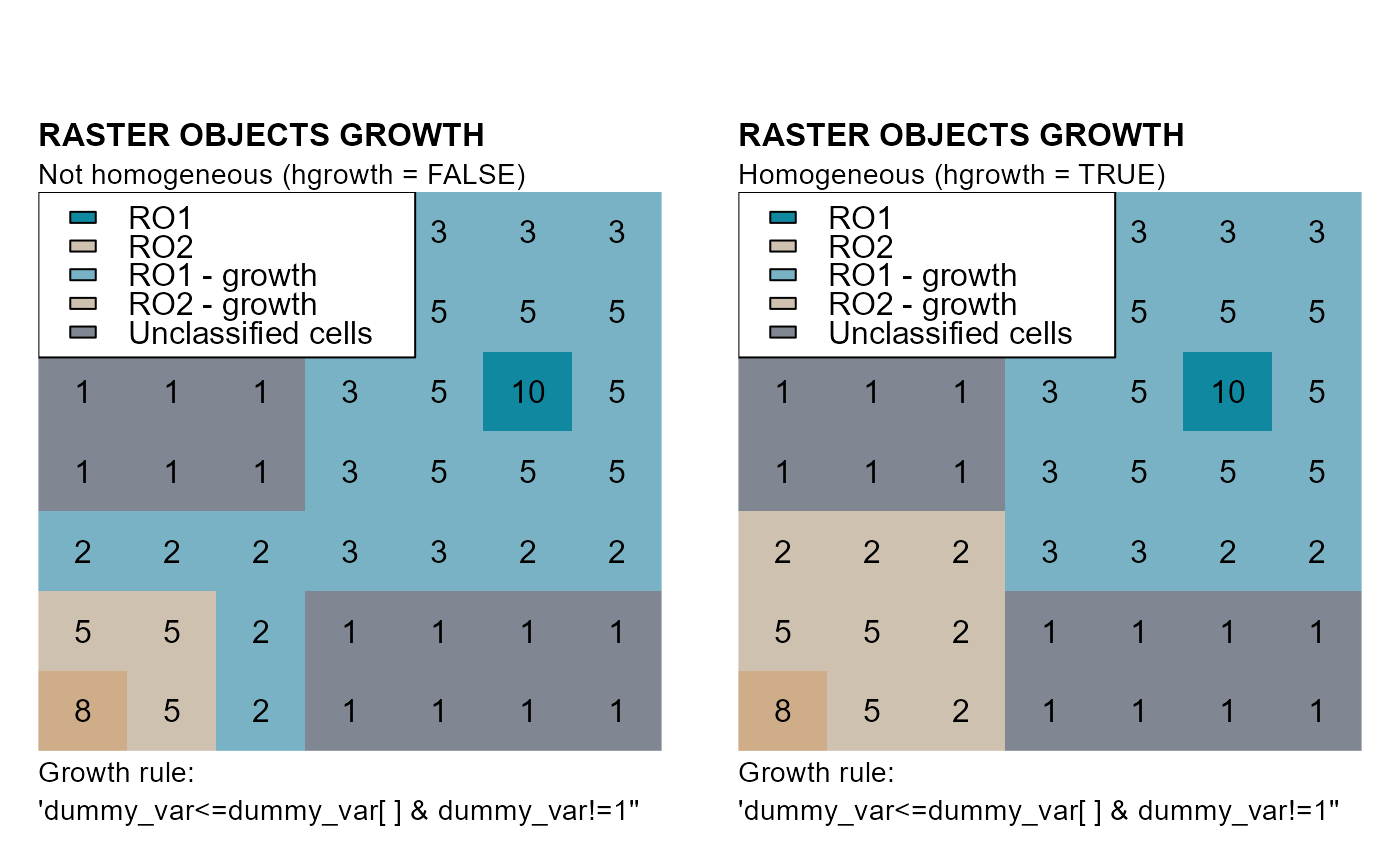
Homogeneous growth (hgrowth)
If the argument hgrowth is true the classes in nbs_of are
treated as discrete raster objects and the argument class is
ignored. Iterations proceed as follow:
cells contiguous to the first element of
nbs_ofare evaluated against the classification rules and, when evaluations are true, cells are assigned to that element;the same process is repeated for cells contiguous to the second element of
nbs_of, then for cells contiguous to the third element and so on until the last element ofnbs_of;once cells contiguous to the last element of
nbs_ofare evaluated the iteration is complete;cells classified in one iteration become focal cells in the next iteration;
a new iteration starts as long as new cells were classified in the previous iteration and if the iteration number <
max.iter.
See also
Examples
# DUMMY DATA
######################################################################################
# LOAD LIBRARIES
library(scapesClassification)
library(terra)
# LOAD THE DUMMY RASTER
r <- list.files(system.file("extdata", package = "scapesClassification"),
pattern = "dummy_raster\\.tif", full.names = TRUE)
r <- terra::rast(r)
# COMPUTE THE ATTRIBUTE TABLE
at <- attTbl(r, "dummy_var")
# COMPUTE THE LIST OF NEIGBORHOODS
nbs <- ngbList(r)
# SET A DUMMY FOCAL CELL (CELL #25)
at$cv[at$Cell == 25] <- 0
# SET FIGURE MARGINS
m <- c(2, 8, 2.5, 8)
######################################################################################
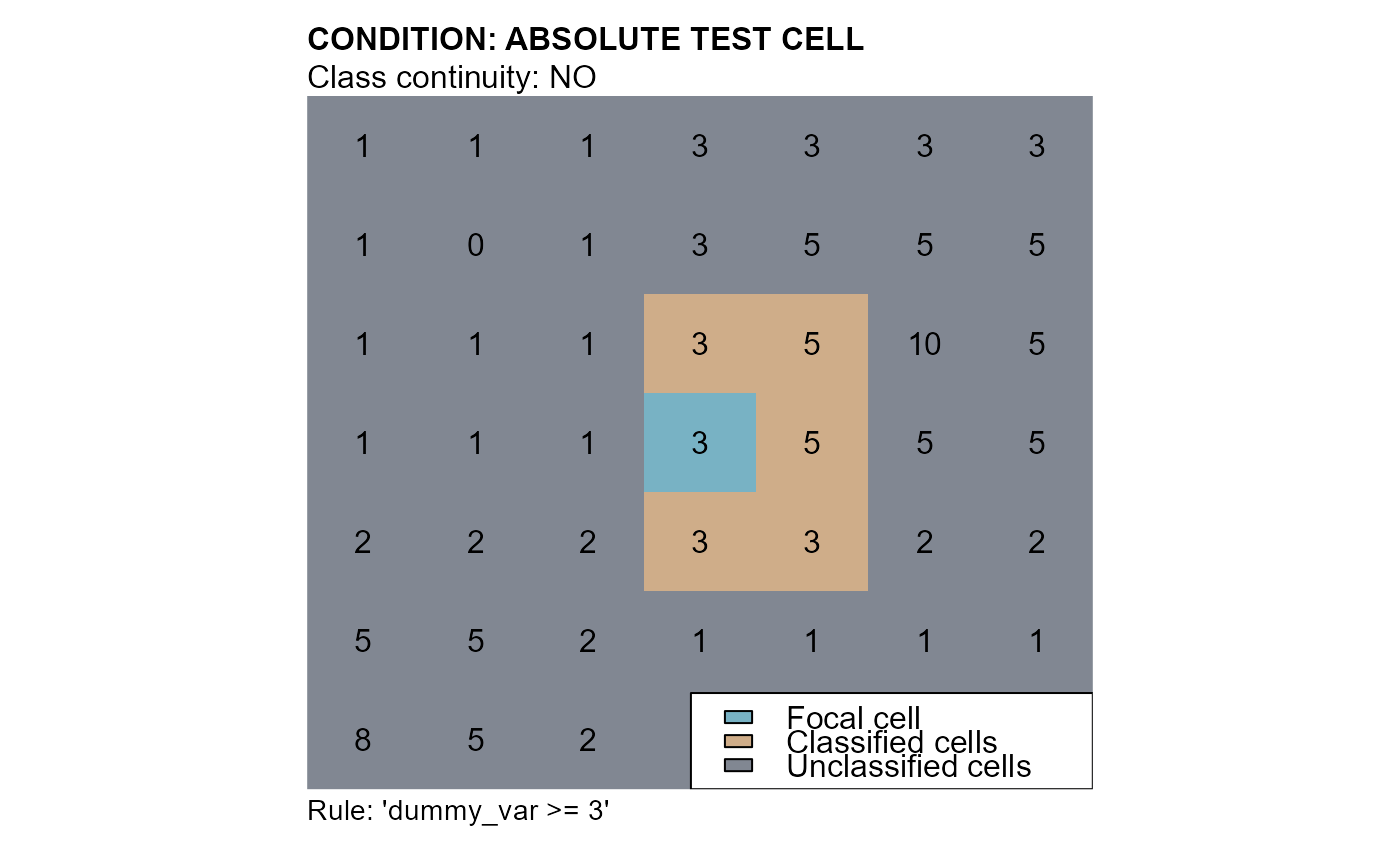
# ABSOLUTE TEST CELL CONDITION - NO CLASS CONTINUITY
######################################################################################
# conditions: "dummy_var >= 3"
cv1 <- cond.4.nofn(attTbl = at, ngbList = nbs,
# CLASS VECTOR - INPUT
classVector = at$cv,
# CLASSIFICATION NUMBER
class = 1,
# FOCAL CELL CLASS
nbs_of = 0,
# ABSOLUTE TEST CELL CONDITION
cond = "dummy_var >= 3")
# CONVERT THE CLASS VECTOR INTO A RASTER
r_cv1 <- cv.2.rast(r, at$Cell,classVector = cv1, plot = FALSE)
# PLOT
plot(r_cv1, type="classes", axes=FALSE, legend = FALSE, asp = NA, mar = m,
colNA="#818792", col=c("#78b2c4", "#cfad89"))
text(r)
mtext(side=3, line=1, adj=0, cex=1, font=2, "CONDITION: ABSOLUTE TEST CELL")
mtext(side=3, line=0, adj=0, cex=1, "Class continuity: NO")
mtext(side=1, line=0, cex=0.9, adj=0, "Rule: 'dummy_var >= 3'")
legend("bottomright", bg = "white", fill = c("#78b2c4", "#cfad89", "#818792"),
legend = c("Focal cell", "Classified cells", "Unclassified cells"))
 ######################################################################################
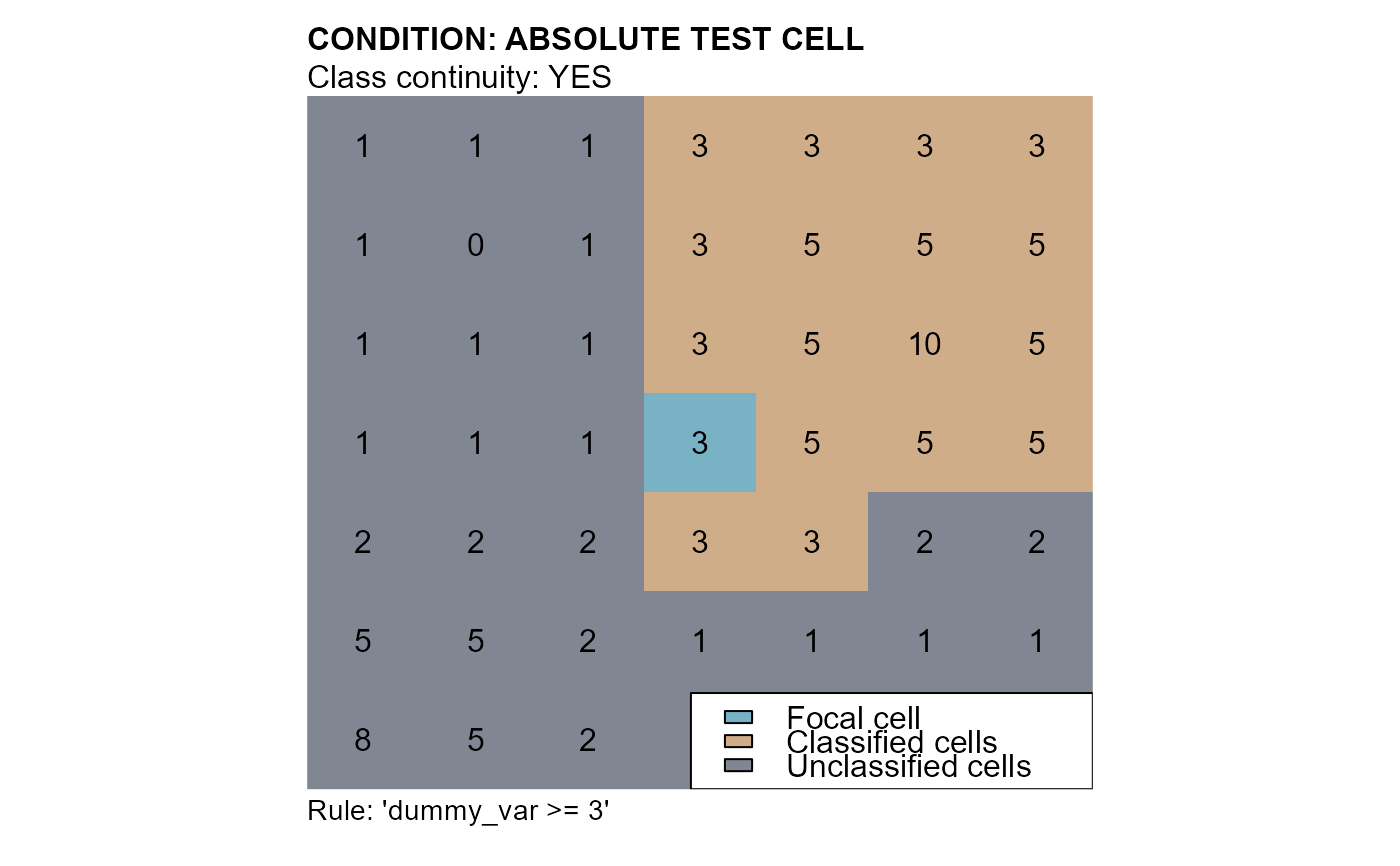
# ABSOLUTE TEST CELL CONDITION - WITH CLASS CONTINUITY
######################################################################################
# conditions: "dummy_var >= 3"
cv2 <- cond.4.nofn(attTbl = at, ngbList = nbs, classVector = at$cv,
# CLASSIFICATION NUMBER
class = 1,
nbs_of = c(0, # FOCAL CELL CLASS
1), # CLASSIFICATION NUMBER
# ABSOLUTE CONDITION
cond = "dummy_var >= 3")
# CONVERT THE CLASS VECTOR INTO A RASTER
r_cv2 <- cv.2.rast(r, at$Cell,classVector = cv2, plot = FALSE)
# PLOT
plot(r_cv2, type="classes", axes=FALSE, legend = FALSE, asp = NA, mar = m,
colNA="#818792", col=c("#78b2c4", "#cfad89"))
text(r)
mtext(side=3, line=1, adj=0, cex=1, font=2, "CONDITION: ABSOLUTE TEST CELL")
mtext(side=3, line=0, adj=0, cex=1, "Class continuity: YES")
mtext(side=1, line=0, cex=0.9, adj=0, "Rule: 'dummy_var >= 3'")
legend("bottomright", bg = "white", fill = c("#78b2c4", "#cfad89", "#818792"),
legend = c("Focal cell", "Classified cells", "Unclassified cells"))
######################################################################################
# ABSOLUTE TEST CELL CONDITION - WITH CLASS CONTINUITY
######################################################################################
# conditions: "dummy_var >= 3"
cv2 <- cond.4.nofn(attTbl = at, ngbList = nbs, classVector = at$cv,
# CLASSIFICATION NUMBER
class = 1,
nbs_of = c(0, # FOCAL CELL CLASS
1), # CLASSIFICATION NUMBER
# ABSOLUTE CONDITION
cond = "dummy_var >= 3")
# CONVERT THE CLASS VECTOR INTO A RASTER
r_cv2 <- cv.2.rast(r, at$Cell,classVector = cv2, plot = FALSE)
# PLOT
plot(r_cv2, type="classes", axes=FALSE, legend = FALSE, asp = NA, mar = m,
colNA="#818792", col=c("#78b2c4", "#cfad89"))
text(r)
mtext(side=3, line=1, adj=0, cex=1, font=2, "CONDITION: ABSOLUTE TEST CELL")
mtext(side=3, line=0, adj=0, cex=1, "Class continuity: YES")
mtext(side=1, line=0, cex=0.9, adj=0, "Rule: 'dummy_var >= 3'")
legend("bottomright", bg = "white", fill = c("#78b2c4", "#cfad89", "#818792"),
legend = c("Focal cell", "Classified cells", "Unclassified cells"))
 ######################################################################################
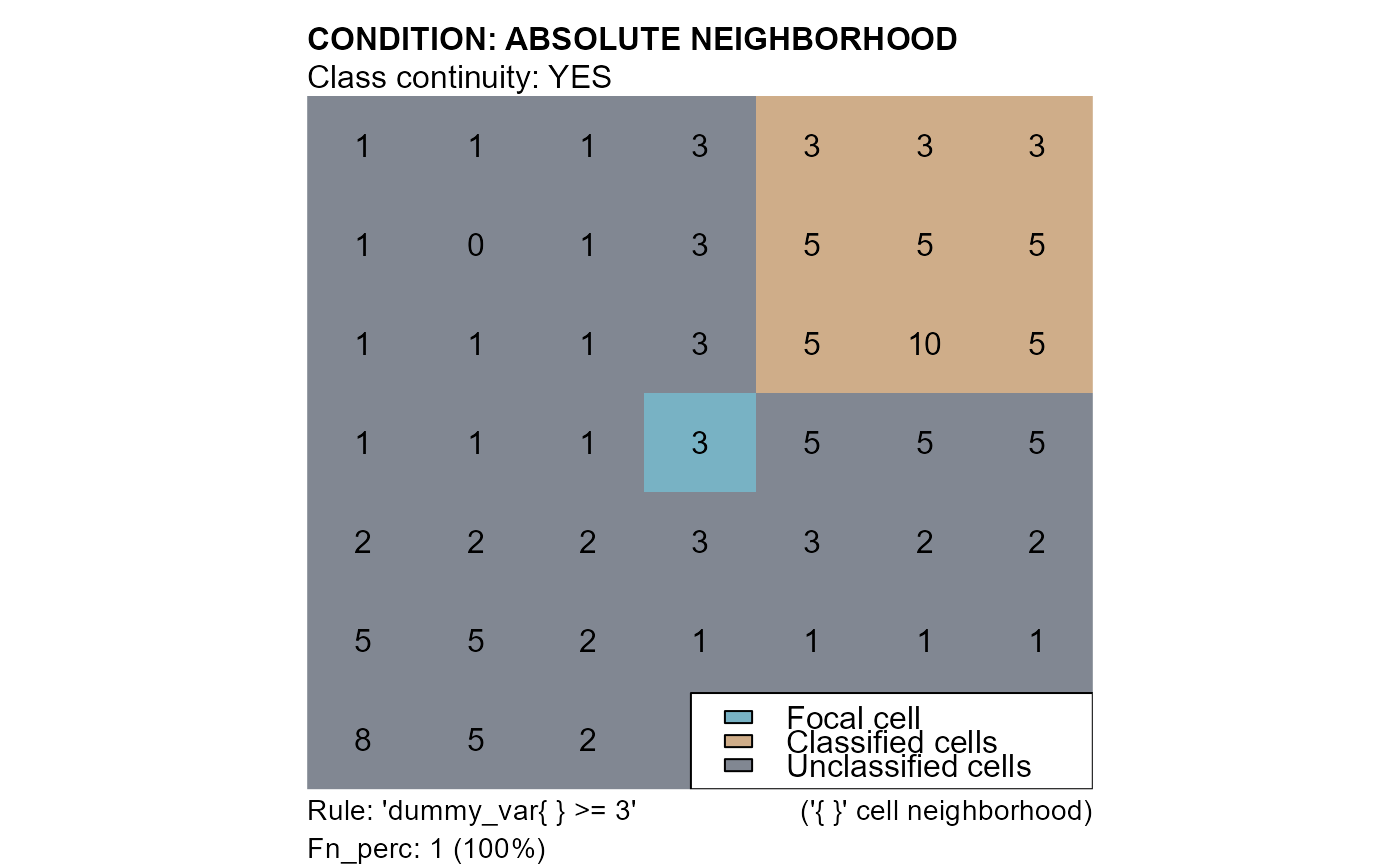
# ABSOLUTE NEIGHBORHOOD CONDITION
######################################################################################
# conditions: "dummy_var{} >= 3"
cv3 <- cond.4.nofn(attTbl = at, ngbList = nbs, classVector = at$cv, nbs_of = c(0,1), class = 1,
# ABSOLUTE NEIGHBORHOOD CONDITION
cond = "dummy_var{} >= 3",
# RULE HAS TO BE TRUE FOR 100% OF THE EVALUATIONS
peval = 1)
# CONVERT THE CLASS VECTOR INTO A RASTER
r_cv3 <- cv.2.rast(r, at$Cell,classVector = cv3, plot = FALSE)
#PLOT
plot(r_cv3, type="classes", axes=FALSE, legend = FALSE, asp = NA, mar = m,
colNA="#818792", col=c("#78b2c4", "#cfad89"))
text(r)
mtext(side=3, line=1, adj=0, cex=1, font=2, "CONDITION: ABSOLUTE NEIGHBORHOOD")
mtext(side=3, line=0, adj=0, cex=1, "Class continuity: YES")
mtext(side=1, line=0, cex=0.9, adj=0, "Rule: 'dummy_var{ } >= 3'")
mtext(side=1, line=0, cex=0.9, adj=1, "('{ }' cell neighborhood)")
mtext(side=1, line=1, cex=0.9, adj=0, "Fn_perc: 1 (100%)")
legend("bottomright", bg = "white", fill = c("#78b2c4", "#cfad89", "#818792"),
legend = c("Focal cell", "Classified cells", "Unclassified cells"))
######################################################################################
# ABSOLUTE NEIGHBORHOOD CONDITION
######################################################################################
# conditions: "dummy_var{} >= 3"
cv3 <- cond.4.nofn(attTbl = at, ngbList = nbs, classVector = at$cv, nbs_of = c(0,1), class = 1,
# ABSOLUTE NEIGHBORHOOD CONDITION
cond = "dummy_var{} >= 3",
# RULE HAS TO BE TRUE FOR 100% OF THE EVALUATIONS
peval = 1)
# CONVERT THE CLASS VECTOR INTO A RASTER
r_cv3 <- cv.2.rast(r, at$Cell,classVector = cv3, plot = FALSE)
#PLOT
plot(r_cv3, type="classes", axes=FALSE, legend = FALSE, asp = NA, mar = m,
colNA="#818792", col=c("#78b2c4", "#cfad89"))
text(r)
mtext(side=3, line=1, adj=0, cex=1, font=2, "CONDITION: ABSOLUTE NEIGHBORHOOD")
mtext(side=3, line=0, adj=0, cex=1, "Class continuity: YES")
mtext(side=1, line=0, cex=0.9, adj=0, "Rule: 'dummy_var{ } >= 3'")
mtext(side=1, line=0, cex=0.9, adj=1, "('{ }' cell neighborhood)")
mtext(side=1, line=1, cex=0.9, adj=0, "Fn_perc: 1 (100%)")
legend("bottomright", bg = "white", fill = c("#78b2c4", "#cfad89", "#818792"),
legend = c("Focal cell", "Classified cells", "Unclassified cells"))
 ######################################################################################
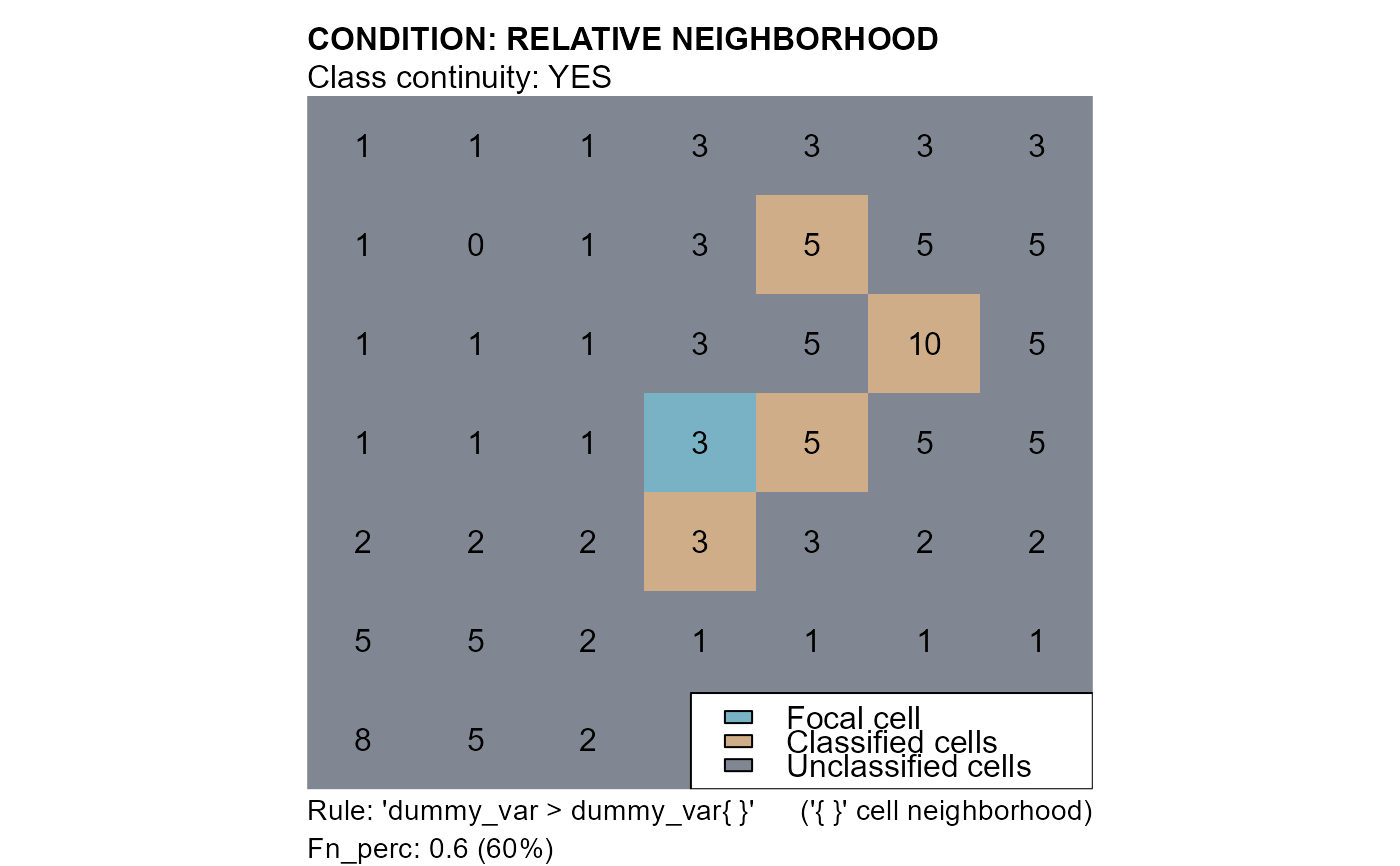
# RELATIVE NEIGHBORHOOD CONDITION
######################################################################################
# conditions: "dummy_var > dummy_var{}"
cv4 <- cond.4.nofn(attTbl = at, ngbList = nbs, classVector = at$cv, nbs_of = c(0,1), class = 1,
# RELATIVE NEIGHBORHOOD CONDITION
cond = "dummy_var > dummy_var{}",
# RULE HAS TO BE TRUE FOR AT LEAST 60% OF THE EVALUATIONS
peval = 0.6)
# CONVERT THE CLASS VECTOR INTO A RASTER
r_cv4 <- cv.2.rast(r, at$Cell, classVector = cv4, plot = FALSE)
#PLOT
plot(r_cv4, type="classes", axes=FALSE, legend = FALSE, asp = NA, mar = m,
colNA="#818792", col=c("#78b2c4", "#cfad89"))
text(r)
mtext(side=3, line=1, adj=0, cex=1, font=2, "CONDITION: RELATIVE NEIGHBORHOOD")
mtext(side=3, line=0, adj=0, cex=1, "Class continuity: YES")
mtext(side=1, line=0, cex=0.9, adj=0, "Rule: 'dummy_var > dummy_var{ }'")
mtext(side=1, line=0, cex=0.9, adj=1, "('{ }' cell neighborhood)")
mtext(side=1, line=1, cex=0.9, adj=0, "Fn_perc: 0.6 (60%)")
legend("bottomright", bg = "white", fill = c("#78b2c4", "#cfad89", "#818792"),
legend = c("Focal cell", "Classified cells", "Unclassified cells"))
######################################################################################
# RELATIVE NEIGHBORHOOD CONDITION
######################################################################################
# conditions: "dummy_var > dummy_var{}"
cv4 <- cond.4.nofn(attTbl = at, ngbList = nbs, classVector = at$cv, nbs_of = c(0,1), class = 1,
# RELATIVE NEIGHBORHOOD CONDITION
cond = "dummy_var > dummy_var{}",
# RULE HAS TO BE TRUE FOR AT LEAST 60% OF THE EVALUATIONS
peval = 0.6)
# CONVERT THE CLASS VECTOR INTO A RASTER
r_cv4 <- cv.2.rast(r, at$Cell, classVector = cv4, plot = FALSE)
#PLOT
plot(r_cv4, type="classes", axes=FALSE, legend = FALSE, asp = NA, mar = m,
colNA="#818792", col=c("#78b2c4", "#cfad89"))
text(r)
mtext(side=3, line=1, adj=0, cex=1, font=2, "CONDITION: RELATIVE NEIGHBORHOOD")
mtext(side=3, line=0, adj=0, cex=1, "Class continuity: YES")
mtext(side=1, line=0, cex=0.9, adj=0, "Rule: 'dummy_var > dummy_var{ }'")
mtext(side=1, line=0, cex=0.9, adj=1, "('{ }' cell neighborhood)")
mtext(side=1, line=1, cex=0.9, adj=0, "Fn_perc: 0.6 (60%)")
legend("bottomright", bg = "white", fill = c("#78b2c4", "#cfad89", "#818792"),
legend = c("Focal cell", "Classified cells", "Unclassified cells"))
 ######################################################################################
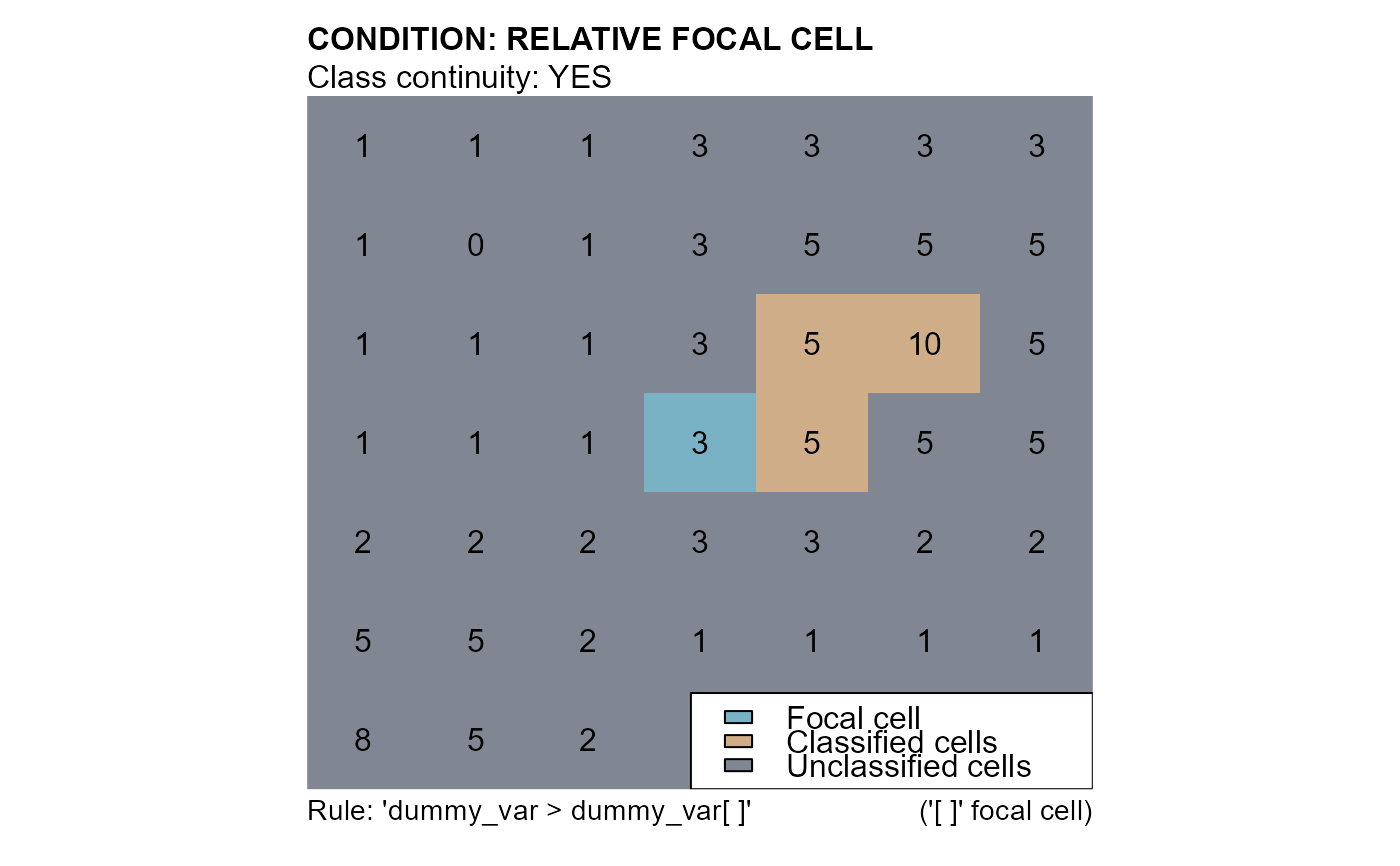
# RELATIVE FOCAL CELL CONDITION
######################################################################################
# conditions: "dummy_var > dummy_var[]"
cv5 <- cond.4.nofn(attTbl = at, ngbList = nbs, classVector = at$cv, nbs_of = c(0,1), class = 1,
# RELATIVE FOCAL CELL CONDITION
cond = "dummy_var > dummy_var[]")
# CONVERT THE CLASS VECTOR INTO A RASTER
r_cv5 <- cv.2.rast(r, at$Cell,classVector = cv5, plot = FALSE)
#PLOT
plot(r_cv5, type="classes", axes=FALSE, legend = FALSE, asp = NA, mar = m,
colNA="#818792", col=c("#78b2c4", "#cfad89"))
text(r)
mtext(side=3, line=1, adj=0, cex=1, font=2, "CONDITION: RELATIVE FOCAL CELL")
mtext(side=3, line=0, adj=0, cex=1, "Class continuity: YES")
mtext(side=1, line=0, cex=0.9, adj=0, "Rule: 'dummy_var > dummy_var[ ]'")
mtext(side=1, line=0, cex=0.9, adj=1, "('[ ]' focal cell)")
legend("bottomright", bg = "white", fill = c("#78b2c4", "#cfad89", "#818792"),
legend = c("Focal cell", "Classified cells", "Unclassified cells"))
######################################################################################
# RELATIVE FOCAL CELL CONDITION
######################################################################################
# conditions: "dummy_var > dummy_var[]"
cv5 <- cond.4.nofn(attTbl = at, ngbList = nbs, classVector = at$cv, nbs_of = c(0,1), class = 1,
# RELATIVE FOCAL CELL CONDITION
cond = "dummy_var > dummy_var[]")
# CONVERT THE CLASS VECTOR INTO A RASTER
r_cv5 <- cv.2.rast(r, at$Cell,classVector = cv5, plot = FALSE)
#PLOT
plot(r_cv5, type="classes", axes=FALSE, legend = FALSE, asp = NA, mar = m,
colNA="#818792", col=c("#78b2c4", "#cfad89"))
text(r)
mtext(side=3, line=1, adj=0, cex=1, font=2, "CONDITION: RELATIVE FOCAL CELL")
mtext(side=3, line=0, adj=0, cex=1, "Class continuity: YES")
mtext(side=1, line=0, cex=0.9, adj=0, "Rule: 'dummy_var > dummy_var[ ]'")
mtext(side=1, line=0, cex=0.9, adj=1, "('[ ]' focal cell)")
legend("bottomright", bg = "white", fill = c("#78b2c4", "#cfad89", "#818792"),
legend = c("Focal cell", "Classified cells", "Unclassified cells"))
 ######################################################################################
# HOMOGENEOUS GROWTH
######################################################################################
# Dummy raster objects 1 and 2
ro <- as.numeric(rep(NA, NROW(at)))
ro[which(at$dummy_var == 10)] <- 1
ro[which(at$dummy_var == 8)] <- 2
# Not homogeneous growth
nhg <- cond.4.nofn(attTbl = at, ngbList = nbs, classVector = ro,
nbs_of = 1, class = 1, # GROWTH ROBJ 1
cond = "dummy_var <= dummy_var[] & dummy_var != 1")
nhg <- cond.4.nofn(attTbl = at, ngbList = nbs, classVector = nhg, # UPDATE nhg
nbs_of = 2, class = 2, # GROWTH ROBJ 2
cond = "dummy_var <= dummy_var[] & dummy_var != 1")
# Homogeneous growth
hg <- cond.4.nofn(attTbl = at, ngbList = nbs, classVector = ro,
nbs_of = c(1, 2), class = NULL,
cond = "dummy_var <= dummy_var[] & dummy_var != 1",
hgrowth = TRUE) # HOMOGENEOUS GROWTH
# Convert class vectors into rasters
r_nhg <- cv.2.rast(r, at$Cell,classVector = nhg, plot = FALSE)
r_hg <- cv.2.rast(r, at$Cell,classVector = hg, plot = FALSE)
# Plots
oldpar <- par(mfrow = c(1,2))
m <- c(3, 1, 5, 1)
# Original raster objects (for plotting)
r_nhg[at$dummy_var == 10] <- 3
r_nhg[at$dummy_var == 8] <- 4
r_hg[at$dummy_var == 10] <- 3
r_hg[at$dummy_var == 8] <- 4
#t
# 1)
plot(r_nhg, type="classes", axes=FALSE, legend=FALSE, asp=NA, mar = m,
colNA="#818792", col=c("#78b2c4", "#cfc1af", "#1088a0", "#cfad89"))
text(r)
mtext(side=3, line=1, adj=0, cex=1, font=2, "RASTER OBJECTS GROWTH")
mtext(side=3, line=0, adj=0, cex=0.9, "Not homogeneous (hgrowth = FALSE)")
mtext(side=1, line=0, cex=0.9, adj=0, "Growth rule:")
mtext(side=1, line=1, cex=0.9, adj=0, "'dummy_var<=dummy_var[ ] & dummy_var!=1''")
legend("topleft", bg = "white", y.intersp= 1.3,
fill = c("#1088a0", "#cfc1af", "#78b2c4", "#cfc1af", "#818792"),
legend = c("RO1", "RO2", "RO1 - growth", "RO2 - growth", "Unclassified cells"))
# 2)
plot(r_hg, type="classes", axes=FALSE, legend=FALSE, asp=NA, mar = m,
colNA="#818792", col=c("#78b2c4", "#cfc1af", "#1088a0", "#cfad89"))
text(r)
mtext(side=3, line=1, adj=0, cex=1, font=2, "RASTER OBJECTS GROWTH")
mtext(side=3, line=0, adj=0, cex=0.9, "Homogeneous (hgrowth = TRUE)")
mtext(side=1, line=0, cex=0.9, adj=0, "Growth rule:")
mtext(side=1, line=1, cex=0.9, adj=0, "'dummy_var<=dummy_var[ ] & dummy_var!=1''")
legend("topleft", bg = "white", y.intersp= 1.3,
fill = c("#1088a0", "#cfc1af", "#78b2c4", "#cfc1af", "#818792"),
legend = c("RO1", "RO2", "RO1 - growth", "RO2 - growth", "Unclassified cells"))
######################################################################################
# HOMOGENEOUS GROWTH
######################################################################################
# Dummy raster objects 1 and 2
ro <- as.numeric(rep(NA, NROW(at)))
ro[which(at$dummy_var == 10)] <- 1
ro[which(at$dummy_var == 8)] <- 2
# Not homogeneous growth
nhg <- cond.4.nofn(attTbl = at, ngbList = nbs, classVector = ro,
nbs_of = 1, class = 1, # GROWTH ROBJ 1
cond = "dummy_var <= dummy_var[] & dummy_var != 1")
nhg <- cond.4.nofn(attTbl = at, ngbList = nbs, classVector = nhg, # UPDATE nhg
nbs_of = 2, class = 2, # GROWTH ROBJ 2
cond = "dummy_var <= dummy_var[] & dummy_var != 1")
# Homogeneous growth
hg <- cond.4.nofn(attTbl = at, ngbList = nbs, classVector = ro,
nbs_of = c(1, 2), class = NULL,
cond = "dummy_var <= dummy_var[] & dummy_var != 1",
hgrowth = TRUE) # HOMOGENEOUS GROWTH
# Convert class vectors into rasters
r_nhg <- cv.2.rast(r, at$Cell,classVector = nhg, plot = FALSE)
r_hg <- cv.2.rast(r, at$Cell,classVector = hg, plot = FALSE)
# Plots
oldpar <- par(mfrow = c(1,2))
m <- c(3, 1, 5, 1)
# Original raster objects (for plotting)
r_nhg[at$dummy_var == 10] <- 3
r_nhg[at$dummy_var == 8] <- 4
r_hg[at$dummy_var == 10] <- 3
r_hg[at$dummy_var == 8] <- 4
#t
# 1)
plot(r_nhg, type="classes", axes=FALSE, legend=FALSE, asp=NA, mar = m,
colNA="#818792", col=c("#78b2c4", "#cfc1af", "#1088a0", "#cfad89"))
text(r)
mtext(side=3, line=1, adj=0, cex=1, font=2, "RASTER OBJECTS GROWTH")
mtext(side=3, line=0, adj=0, cex=0.9, "Not homogeneous (hgrowth = FALSE)")
mtext(side=1, line=0, cex=0.9, adj=0, "Growth rule:")
mtext(side=1, line=1, cex=0.9, adj=0, "'dummy_var<=dummy_var[ ] & dummy_var!=1''")
legend("topleft", bg = "white", y.intersp= 1.3,
fill = c("#1088a0", "#cfc1af", "#78b2c4", "#cfc1af", "#818792"),
legend = c("RO1", "RO2", "RO1 - growth", "RO2 - growth", "Unclassified cells"))
# 2)
plot(r_hg, type="classes", axes=FALSE, legend=FALSE, asp=NA, mar = m,
colNA="#818792", col=c("#78b2c4", "#cfc1af", "#1088a0", "#cfad89"))
text(r)
mtext(side=3, line=1, adj=0, cex=1, font=2, "RASTER OBJECTS GROWTH")
mtext(side=3, line=0, adj=0, cex=0.9, "Homogeneous (hgrowth = TRUE)")
mtext(side=1, line=0, cex=0.9, adj=0, "Growth rule:")
mtext(side=1, line=1, cex=0.9, adj=0, "'dummy_var<=dummy_var[ ] & dummy_var!=1''")
legend("topleft", bg = "white", y.intersp= 1.3,
fill = c("#1088a0", "#cfc1af", "#78b2c4", "#cfc1af", "#818792"),
legend = c("RO1", "RO2", "RO1 - growth", "RO2 - growth", "Unclassified cells"))
 par(oldpar)