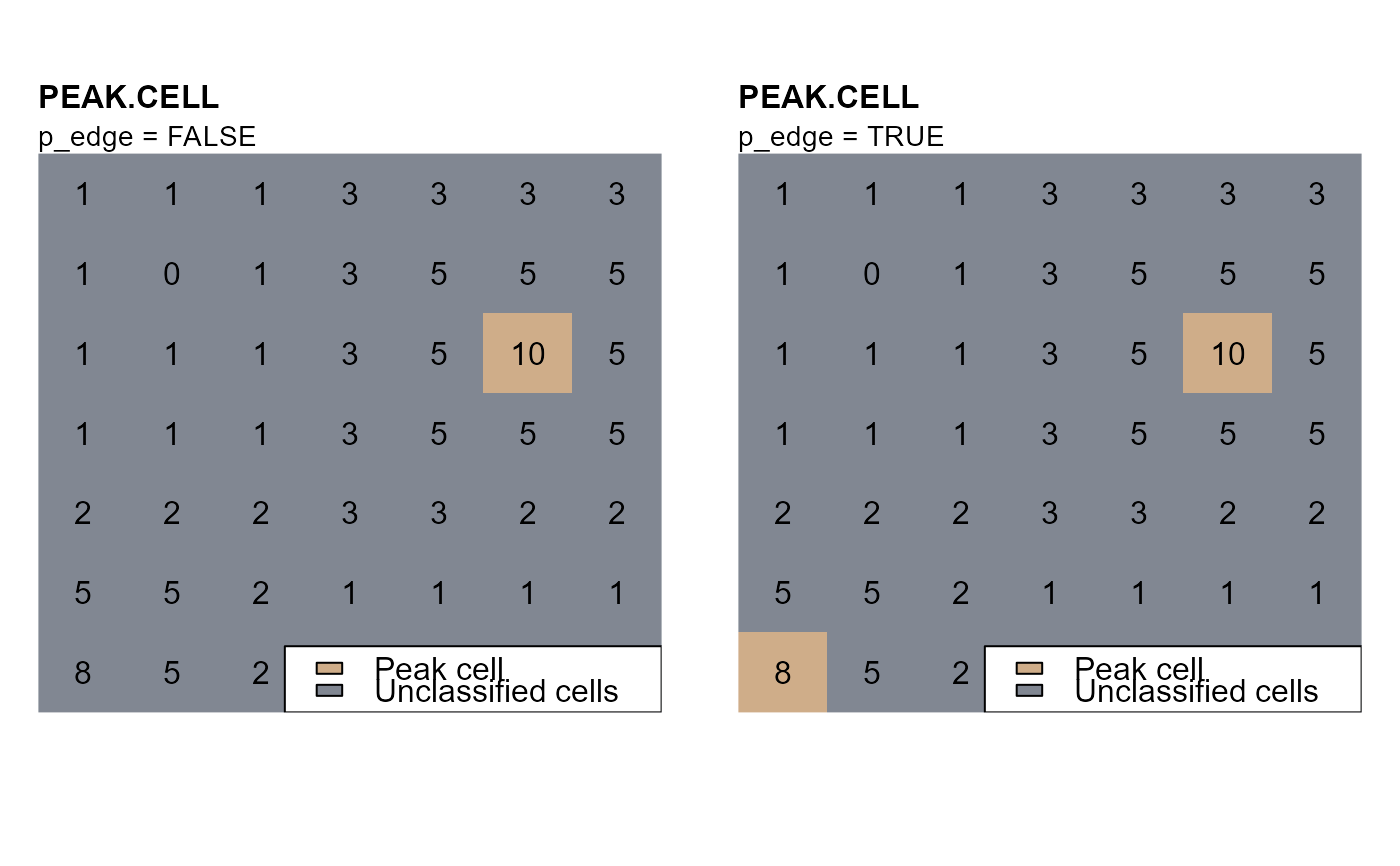
Identify local maxima or minima on a raster surface.
peak.cell(attTbl, ngbList, rNumb = FALSE, p_col, p_fun = "max", p_edge = FALSE)Arguments
- attTbl
data.frame, the attribute table returned by the function
attTbl.- ngbList
list, the list of neighborhoods returned by the function
ngbList.- rNumb
logic, the neighborhoods of the argument
ngbListare identified by cell numbers (rNumb=FALSE) or by row numbers (rNumb=TRUE) (seengbList). It is advised to use row numbers for large rasters.- p_col
character, the column of the attribute table over which maxima or minima are searched.
- p_fun
character, if 'max' the function searches for local maxima; if 'min' the function searches for local minima.
- p_edge
logic, if false local maxima or minima are not searched on edge cells. Edge cells are considered cells on the edge of the raster and cell neighboring NA-cells.
Value
A classVector with peak cells identified by the numeric class
1. See conditions for more details about class
vectors.
Details
See also
Examples
# DUMMY DATA
################################################################################
# LOAD LIBRARIES
library(scapesClassification)
library(terra)

# LOAD THE DUMMY RASTER
r <- list.files(system.file("extdata", package = "scapesClassification"),
                pattern = "dummy_raster\\.tif", full.names = TRUE)
r <- terra::rast(r)

# COMPUTE THE ATTRIBUTE TABLE
at <- attTbl(r, "dummy_var")

# COMPUTE THE LIST OF NEIGBORHOODS
nbs <- ngbList(r)
################################################################################

# PEAK.CELL
################################################################################
# p_edge = FALSE
pc_a <- peak.cell(attTbl = at, ngbList = nbs, rNumb = FALSE,
                  p_col = "dummy_var", p_fun = "max", p_edge = FALSE)

# p_edge = TRUE
pc_b <- peak.cell(attTbl = at, ngbList = nbs, rNumb = FALSE,
                  p_col = "dummy_var", p_fun = "max", p_edge = TRUE)

# CONVERT THE CLASS VECTORS INTO RASTERS
r_pca <- cv.2.rast(r, at$Cell, classVector = pc_a, plot = FALSE)
r_pcb <- cv.2.rast(r, at$Cell, classVector = pc_b, plot = FALSE)
################################################################################

#PLOTS
###############################################################################
oldpar <- par(mfrow = c(1,2))
m <- c(4, 1, 4, 1)

# PLOT 1 - p_edge = FALSE
plot(r_pca, axes=FALSE, legend=FALSE, asp=NA, mar=m,
     colNA="#818792", col=c("#78b2c4", "#cfad89"))
text(r)
mtext(side=3, line=1, adj=0, cex=1, font=2, "PEAK.CELL")
mtext(side=3, line=0, adj=0, cex=0.9, "p_edge = FALSE")
legend("bottomright", bg = "white",
       legend = c("Peak cell", "Unclassified cells"),
       fill = c("#cfad89", "#818792"))

# PLOT 2 - p_edge = TRUE
plot(r_pcb, axes=FALSE, legend=FALSE, asp=NA, mar=m,
    colNA="#818792", col=c("#78b2c4", "#cfad89"))
text(r)
mtext(side=3, line=1, adj=0, cex=1, font=2, "PEAK.CELL")
mtext(side=3, line=0, adj=0, cex=0.9, "p_edge = TRUE")
legend("bottomright", bg = "white",
       legend = c("Peak cell", "Unclassified cells"),
       fill = c("#cfad89", "#818792"))

par(oldpar)