Compute the relative position index of raster objects.
rel.pi(attTbl, RO, el, type = "s", plot = FALSE, r = NULL)Arguments
- attTbl
data.frame, the attribute table returned by the function
attTbl.- RO
column name, the name of the column with the raster object IDs.
- el
column name, the name of column with the elevation values on which the relative position index is computed.
- type
character, defines if position index values are standardized (
"s") or normalized ("n").- plot
logic, plot the results.
- r
single or multi-layer raster of the class
SpatRaster(seehelp("rast", terra)) used to compute the attribute table. Required only ifplot = TRUE.
Value
The function returns a vector with relative position index values. The vector has length equal to the number of rows of the attribute table. NA values are assigned to cells that do not belong to any raster object.
Details
Position index values are computed only for cells that belong to a raster object.
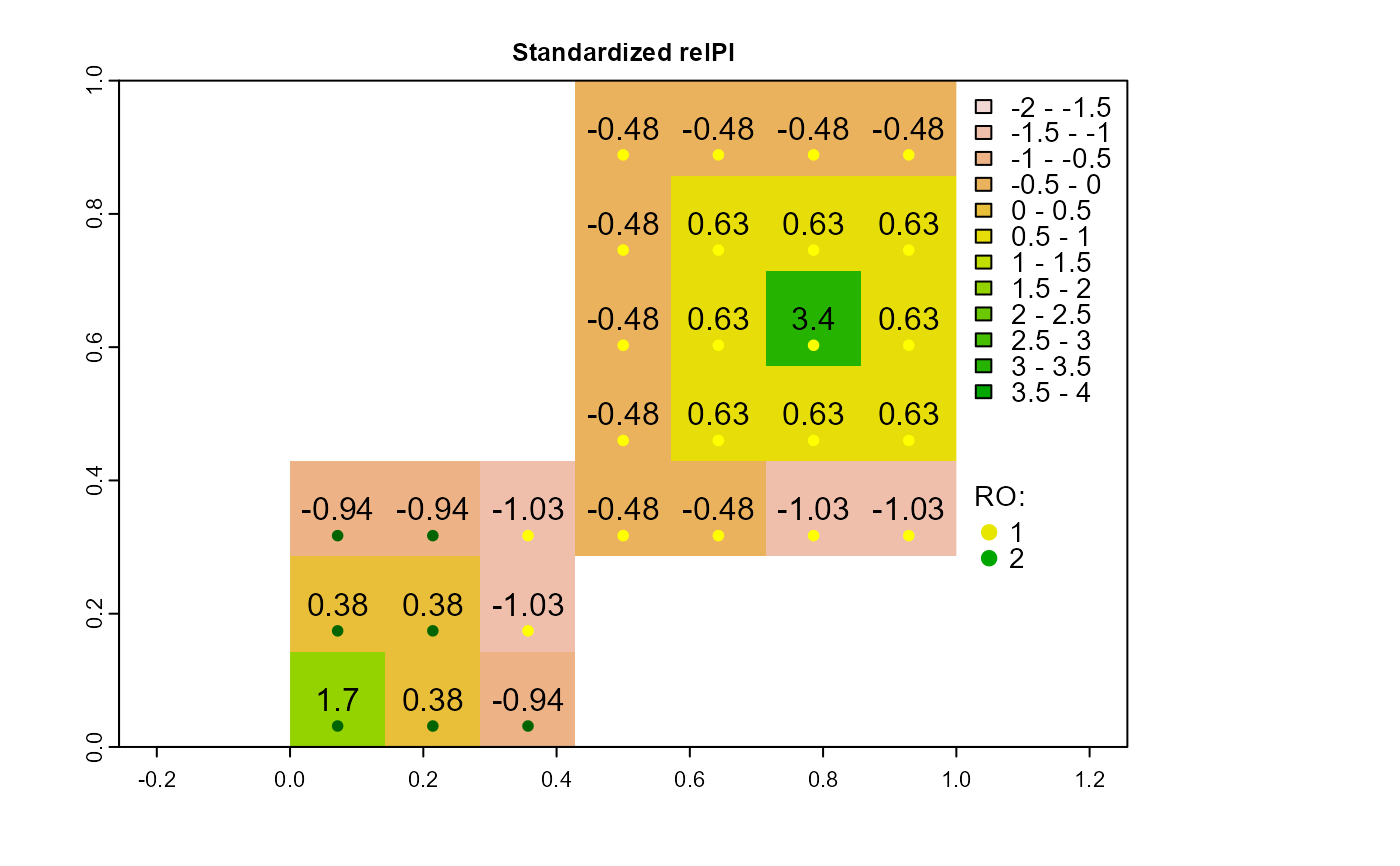
Standardized position index values (
type="s") are computed with the formula( x - mean(x) ) / sd(x);Normalized position index values (
type="n") are computed with the formula( x - min(x) ) / ( max(x) - min(x) );Variable
xrepresents the elevation values of individual raster object.
Examples
# DUMMY DATA
######################################################################################
# LOAD LIBRARIES
library(scapesClassification)
library(terra)
# LOAD THE DUMMY RASTER
r <- list.files(system.file("extdata", package = "scapesClassification"),
pattern = "dummy_raster\\.tif", full.names = TRUE)
r <- terra::rast(r)
# COMPUTE THE ATTRIBUTE TABLE
at <- attTbl(r, "dummy_var")
# COMPUTE THE LIST OF NEIGBORHOODS
nbs <- ngbList(r, rNumb=TRUE, attTbl=at) # rnumb MUST be true to use obj.nbs
################################################################################
# COMPUTE RASTER OBJECTS
################################################################################
at$RO <- anchor.seed(at, nbs, silent=TRUE, class = NULL, rNumb=TRUE,
cond.filter = "dummy_var > 1",
cond.seed = "dummy_var==max(dummy_var)",
cond.growth = "dummy_var<dummy_var[]",
lag.growth = 0)
# Convert class vector at$RO to raster and plot
r_RO <- cv.2.rast(r = r, classVector = at$RO)
terra::plot(r_RO, type="classes", main="Raster objects",
plg=list(x=1, y=1, cex=0.9))
 ################################################################################
# STANDARDIZED RELATIVE POSITION INDEX
################################################################################
relPI <- rel.pi(attTbl = at, RO = "RO", el = "dummy_var",
type = "s",
plot = TRUE, r = r)
# Annotate relPI
points(terra::xFromCell(r, at$Cell[which(at$RO==1)]),
terra::yFromCell(r, at$Cell[which(at$RO==1)]) - 0.04,
pch=20, col="yellow")
points(terra::xFromCell(r, at$Cell[which(at$RO==2)]),
terra::yFromCell(r, at$Cell[which(at$RO==2)]) - 0.04,
pch=20, col="darkgreen")
text(xyFromCell(r,at$Cell), as.character(round(relPI,2)))
legend(1.02, 0.4, legend=c("1", "2"), bty = "n", title="RO:", xpd=TRUE,
col=c("#E6E600", "#00A600"), pch=20, cex=0.9, pt.cex = 1.5)
################################################################################
# STANDARDIZED RELATIVE POSITION INDEX
################################################################################
relPI <- rel.pi(attTbl = at, RO = "RO", el = "dummy_var",
type = "s",
plot = TRUE, r = r)
# Annotate relPI
points(terra::xFromCell(r, at$Cell[which(at$RO==1)]),
terra::yFromCell(r, at$Cell[which(at$RO==1)]) - 0.04,
pch=20, col="yellow")
points(terra::xFromCell(r, at$Cell[which(at$RO==2)]),
terra::yFromCell(r, at$Cell[which(at$RO==2)]) - 0.04,
pch=20, col="darkgreen")
text(xyFromCell(r,at$Cell), as.character(round(relPI,2)))
legend(1.02, 0.4, legend=c("1", "2"), bty = "n", title="RO:", xpd=TRUE,
col=c("#E6E600", "#00A600"), pch=20, cex=0.9, pt.cex = 1.5)
 ################################################################################
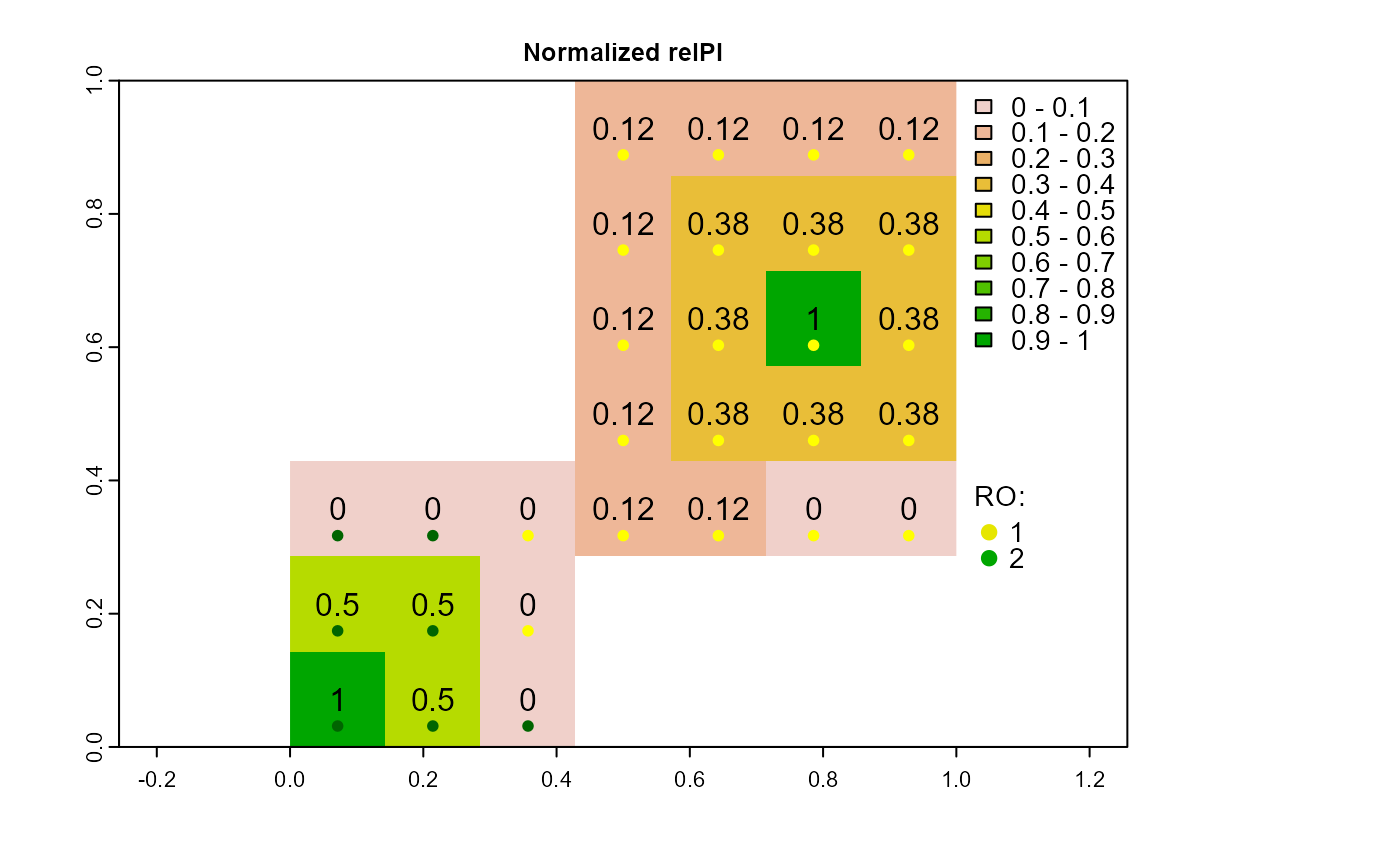
# NORMALIZED RELATIVE POSITION INDEX
################################################################################
# Compute normalized relative position index
relPI <- rel.pi(attTbl = at, RO = "RO", el = "dummy_var",
type = "n",
plot = TRUE, r = r)
# Annotate relPI
points(terra::xFromCell(r, at$Cell[which(at$RO==1)]),
terra::yFromCell(r, at$Cell[which(at$RO==1)]) - 0.04,
pch=20, col="yellow")
points(terra::xFromCell(r, at$Cell[which(at$RO==2)]),
terra::yFromCell(r, at$Cell[which(at$RO==2)]) - 0.04,
pch=20, col="darkgreen")
text(xyFromCell(r,at$Cell), as.character(round(relPI,2)))
legend(1.02, 0.4, legend=c("1", "2"), bty = "n", title="RO:", xpd=TRUE,
col=c("#E6E600", "#00A600"), pch=20, cex=0.9, pt.cex = 1.5)
################################################################################
# NORMALIZED RELATIVE POSITION INDEX
################################################################################
# Compute normalized relative position index
relPI <- rel.pi(attTbl = at, RO = "RO", el = "dummy_var",
type = "n",
plot = TRUE, r = r)
# Annotate relPI
points(terra::xFromCell(r, at$Cell[which(at$RO==1)]),
terra::yFromCell(r, at$Cell[which(at$RO==1)]) - 0.04,
pch=20, col="yellow")
points(terra::xFromCell(r, at$Cell[which(at$RO==2)]),
terra::yFromCell(r, at$Cell[which(at$RO==2)]) - 0.04,
pch=20, col="darkgreen")
text(xyFromCell(r,at$Cell), as.character(round(relPI,2)))
legend(1.02, 0.4, legend=c("1", "2"), bty = "n", title="RO:", xpd=TRUE,
col=c("#E6E600", "#00A600"), pch=20, cex=0.9, pt.cex = 1.5)