Converts a vector of cell numbers into a class vector.
anchor.cell(
  attTbl,
  r,
  anchor,
  class,
  classVector = NULL,
  class2cell = TRUE,
  class2nbs = TRUE,
  overwrite_class = FALSE,
  plot = FALSE,
  writeRaster = NULL,
  overWrite = FALSE
)
Arguments
- attTbl
data.frame, the attribute table returned by the function
attTbl.- r
single or multi-layer raster of the class
SpatRaster(seehelp("rast", terra)) used to compute theattTbl.- anchor
integer vector of raster cell numbers.
- class
numeric, the classification number to assign to all cells that meet the function conditions.
- classVector
numeric vector, if provided, it defines the cells in the attribute table that have already been classified and that have to be ignored by the function (unless the argument
overwrite_class = TRUE).- class2cell
logic, attribute the classification number to the cells of the argument
anchor. If there is aclassVectorinput, the classification number is only assigned toclassVectorNA-cells.- class2nbs
logic, attribute the classification number to cells adjacent to the ones of the argument
anchor. If there is aclassVectorinput, the classification number is only assigned toclassVectorNA-cells.- overwrite_class
logic, if there is a
classVectorinput, reclassify cells that were already classified and that meet the function conditions.- plot
logic, plot the class vector output.
- writeRaster
filename, if a raster name is provided, save the class vector in a raster file.
- overWrite
logic, if the raster names already exist, the existing file is overwritten.
Value
Update classVector with the new cells that were classified by
the function. If there is no classVector input, the function returns
a new class vector. See conditions for more details about
class vectors.
Details
Converts a vector of cell numbers into a class vector. If there is a
classVector input, then the class vector is updated assigning a
classification number to all cells that meet the function conditions.
See also
Examples
# DUMMY DATA
################################################################################
# LOAD LIBRARIES AND DATA
library(scapesClassification)
library(terra)
#> terra 1.5.21
# CELL NUMBERS OF A DUMMY RASTER (7X7)
r_cn <- terra::rast(matrix(1:49, nrow = 7, byrow = TRUE), extent=c(0,1,0,1))
# COMPUTE ATTRIBUTE TABLE AND LIST OF NEIGHBORHOODS
at <- attTbl(r_cn, "dummy_var")
nbs <- ngbList(r_cn)
################################################################################
################################################################################
# ANCHOR.CELL
################################################################################
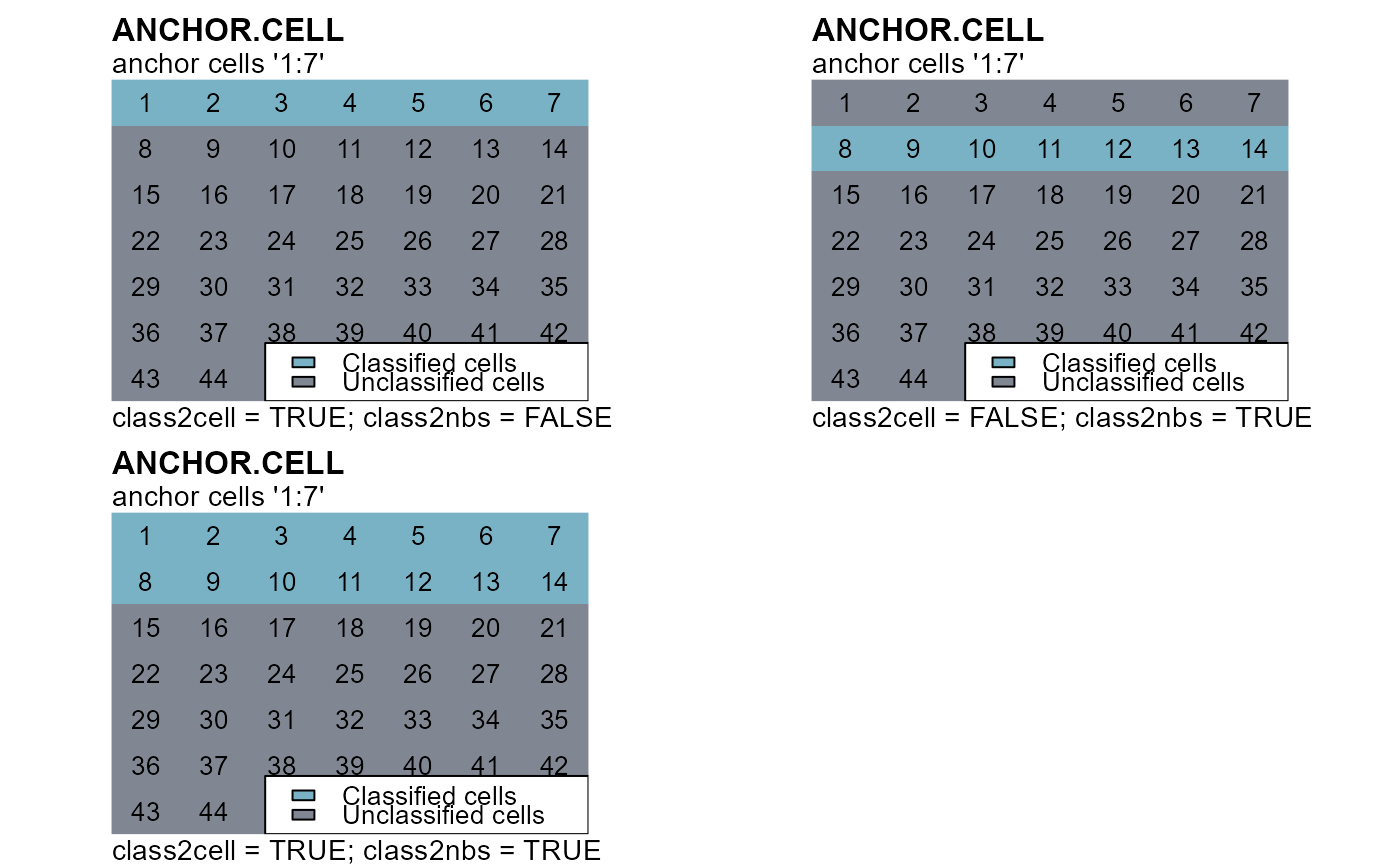
cv1 <- anchor.cell(attTbl = at, r = r_cn, anchor = 1:7, class = 10,
class2cell = TRUE, class2nbs = FALSE)
cv2 <- anchor.cell(attTbl = at, r = r_cn, anchor = 1:7, class = 10,
class2cell = FALSE, class2nbs = TRUE)
cv3 <- anchor.cell(attTbl = at, r = r_cn, anchor = 1:7, class = 10,
class2cell = TRUE, class2nbs = TRUE)
# Convert class vectors to rasters
r_cv1 <- cv.2.rast(r = r_cn, index = at$Cell, classVector = cv1)
r_cv2 <- cv.2.rast(r = r_cn, index = at$Cell, classVector = cv2)
r_cv3 <- cv.2.rast(r = r_cn, index = at$Cell, classVector = cv3)
################################################################################
################################################################################
# PLOTS
################################################################################
oldpar <- par(mfrow = c(2,2))
m = c(1, 3.5, 2.5, 3.5)
# 1)
plot(r_cv1,type="classes",axes=FALSE,legend=FALSE,asp=NA,colNA="#818792",col="#78b2c4",mar=m)
text(r_cn)
mtext(side=3, line=1, adj=0, cex=1, font=2, "ANCHOR.CELL")
mtext(side=3, line=0, adj=0, cex=0.9, "anchor cells '1:7'")
mtext(side=1, line=0, cex=0.9, adj=0, "class2cell = TRUE; class2nbs = FALSE")
legend("bottomright", ncol = 1, bg = "white", fill = c("#78b2c4", "#818792"),
legend = c("Classified cells","Unclassified cells"))
# 2)
plot(r_cv2,type="classes",axes=FALSE,legend=FALSE,asp=NA,colNA="#818792",col="#78b2c4",mar=m)
text(r_cn)
mtext(side=3, line=1, adj=0, cex=1, font=2, "ANCHOR.CELL")
mtext(side=3, line=0, adj=0, cex=0.9, "anchor cells '1:7'")
mtext(side=1, line=0, cex=0.9, adj=0, "class2cell = FALSE; class2nbs = TRUE")
legend("bottomright", ncol = 1, bg = "white", fill = c("#78b2c4", "#818792"),
legend = c("Classified cells","Unclassified cells"))
# 3)
plot(r_cv3,type="classes",axes=FALSE,legend=FALSE,asp=NA,colNA="#818792",col="#78b2c4",mar=m)
text(r_cn)
mtext(side=3, line=1, adj=0, cex=1, font=2, "ANCHOR.CELL")
mtext(side=3, line=0, adj=0, cex=0.9, "anchor cells '1:7'")
mtext(side=1, line=0, cex=0.9, adj=0, "class2cell = TRUE; class2nbs = TRUE")
legend("bottomright", ncol = 1, bg = "white", fill = c("#78b2c4", "#818792"),
legend = c("Classified cells","Unclassified cells"))
par(oldpar)