Identify the borders of raster objects.
obj.border(group, ngbList, silent = FALSE)Arguments
- group
named list, each element represents a raster object composed of several raster cells. If there are NA values on the raster surface, raster cells must be identified by attribute table row indices (each corresponding to a raster cell) (see
attTbl).- ngbList
list, the list of neighborhoods returned by the function
ngbList. The list of neighborhoods has to be computed setting the argumentrNumb=TRUE.- silent
logic, progress bar is not printed on the console.
Value
The function returns a named list of object borders. List names identify the objects; list element values identify the raster cells comprising the borders.
Note
Note that
grouphas to be a named list whose names correspond to raster object IDs.If there are NA values on the raster surface, raster cells must be identified by attribute table row indices (each corresponding to a raster cell). Row indices can be converted into raster cells using the
Cellcolumn of the attribute table (e.g.attTbl$Cell[indices]) (seeattTbl).
Examples
# DUMMY DATA
######################################################################################
# LOAD LIBRARIES
library(scapesClassification)
library(terra)
# LOAD THE DUMMY RASTER
r <- list.files(system.file("extdata", package = "scapesClassification"),
pattern = "dummy_raster\\.tif", full.names = TRUE)
r <- terra::rast(r)
# ADD NA-VALUE
r[11] <- NA
# COMPUTE THE ATTRIBUTE TABLE
at <- attTbl(r, "dummy_var")
# COMPUTE THE LIST OF NEIGBORHOODS
nbs <- ngbList(r, rNumb=TRUE, attTbl=at) # rnumb MUST be true to use obj.border
################################################################################
# COMPUTE RASTER OBJECTS
################################################################################
at$cv <- anchor.seed(at, nbs, silent=TRUE, class = NULL, rNumb=TRUE,
cond.filter = "dummy_var > 1",
cond.seed = "dummy_var==max(dummy_var)",
cond.growth = "dummy_var<dummy_var[]",
lag.growth = 0)
# Raster objects
RO <- split(1:NROW(at), at$cv)
print(RO) # values are attribute table row indices
#> $`1`
#> [1] 4 5 6 7 11 12 13 17 18 19 20 24 25 26 27 30 31 32 33 34 37
#>
#> $`2`
#> [1] 28 29 35 36 42 43 44
#>
################################################################################
# COMPUTE BORDERS
################################################################################
RO_bd <- obj.border(RO, nbs, silent = TRUE)
RO_bd1 <- at$Cell[RO_bd[["1"]]] # Convert row numbers to cell numbers
RO_bd2 <- at$Cell[RO_bd[["2"]]] # Convert row numbers to cell numbers
print(RO_bd) # attribute table row indices
#> $`1`
#> [1] 4 17 24 30 31 32 33 34 37
#>
#> $`2`
#> [1] 29 36 28 43 44
#>
print(RO_bd1) # cell numbers
#> [1] 4 18 25 31 32 33 34 35 38
print(RO_bd2) # cell numbers
#> [1] 30 37 29 44 45
################################################################################
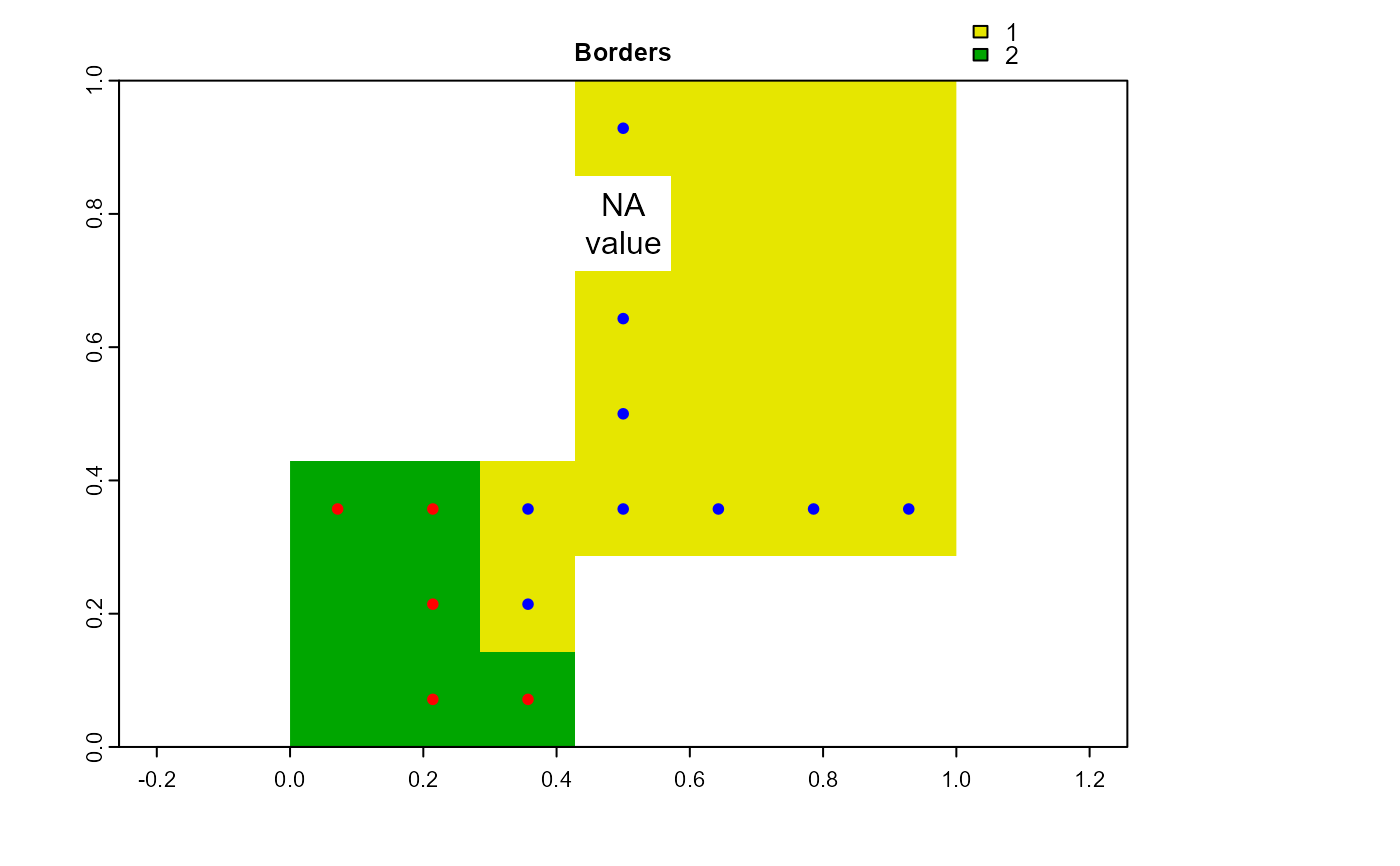
# PLOT BORDERS
################################################################################
plot(cv.2.rast(r,at$cv), type="classes", col=c("#E6E600","#00A600"),
main="Borders")
points(terra::xyFromCell(r, RO_bd1), pch=20, col="blue")
points(terra::xyFromCell(r, RO_bd2), pch=20, col="red")
text(xyFromCell(r, 11), "NA\nvalue")