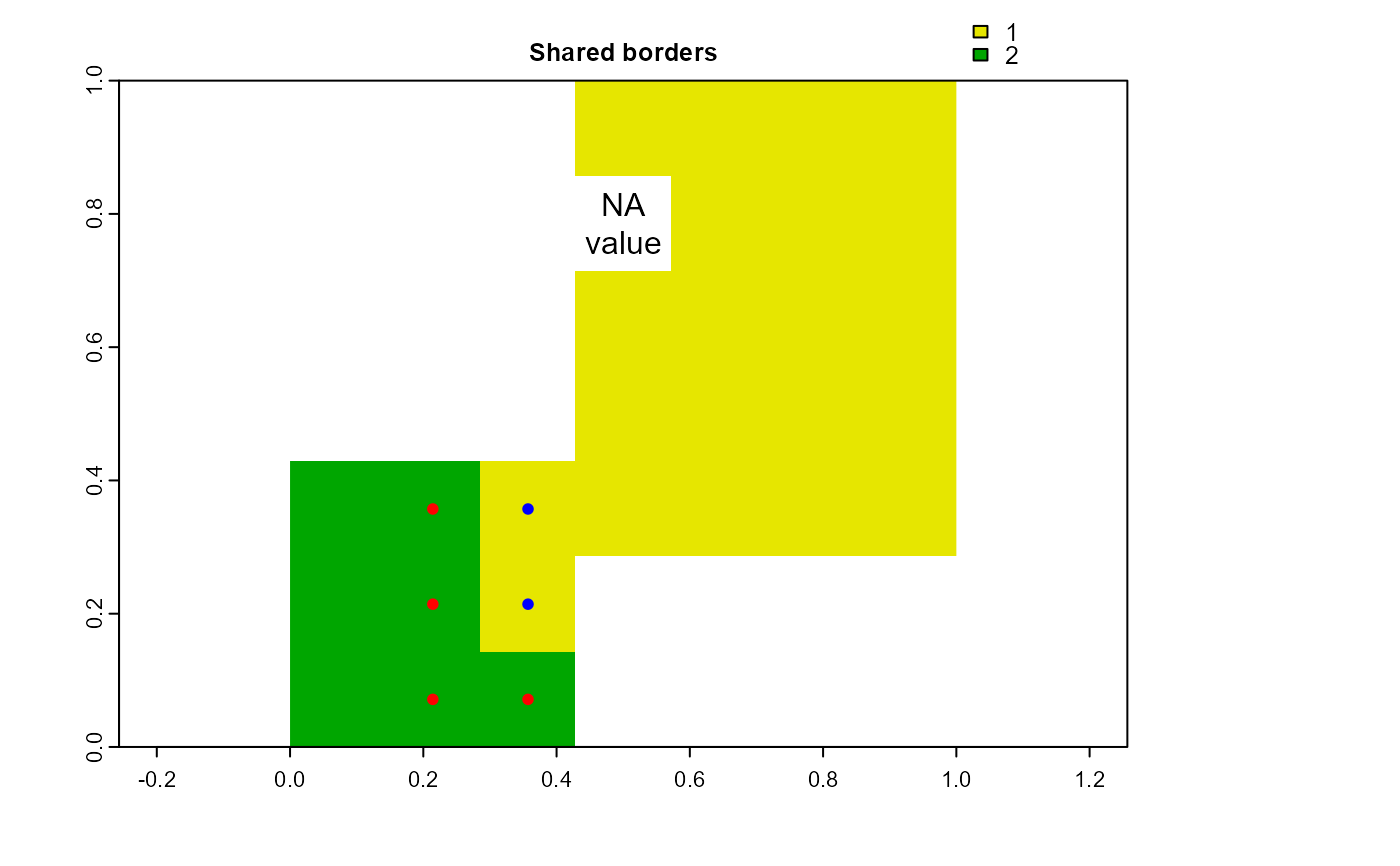
Identify the shared borders of neighboring raster objects.
obj.nbs(grp.bord, ngbList, only_grp = NULL, silent = FALSE)Arguments
- grp.bord
named list, the list of borders returned by the function
obj.border.- ngbList
list, the list of neighborhoods returned by the function
ngbList. The list of neighborhoods has to be computed setting the argumentrNumb=TRUE.- only_grp
character vector. If
NULL, all IDs ingrp.bordare considered. If IDs are provided, then they are the only ones considered.- silent
logic, progress bar is not printed on the console.
Value
The function returns a named list. Each element represents a raster object as identified by the list names and contains a nested named list. The names of the nested lists are the IDs of neighboring raster objects and their values identify the raster cells comprising the shared borders.
Note
If there are NA values on the raster surface, raster cells are
identified by attribute table row indices (each corresponding to a raster
cell). Row indices can be converted into raster cells using the Cell
column of the attribute table (e.g. attTbl$Cell[indices]) (see
attTbl).
See also
Examples
# DUMMY DATA
######################################################################################
# LOAD LIBRARIES
library(scapesClassification)
library(terra)

# LOAD THE DUMMY RASTER
r <- list.files(system.file("extdata", package = "scapesClassification"),
                pattern = "dummy_raster\\.tif", full.names = TRUE)
r <- terra::rast(r)

# ADD ONE NA VALUE
r[11] <- NA

# COMPUTE THE ATTRIBUTE TABLE
at <- attTbl(r, "dummy_var")

# COMPUTE THE LIST OF NEIGBORHOODS
nbs <- ngbList(r, rNumb=TRUE, attTbl=at) # rnumb MUST be true to use obj.nbs

################################################################################
# COMPUTE RASTER OBJECTS
################################################################################
at$cv <- anchor.seed(at, nbs, silent=TRUE, class = NULL, rNumb=TRUE,
                     cond.filter = "dummy_var > 1",
                     cond.seed   = "dummy_var==max(dummy_var)",
                     cond.growth = "dummy_var<dummy_var[]",
                     lag.growth  = 0)

RO <- split(1:NROW(at), at$cv)

print(RO)
#> $`1`
#>  [1]  4  5  6  7 11 12 13 17 18 19 20 24 25 26 27 30 31 32 33 34 37
#>
#> $`2`
#> [1] 28 29 35 36 42 43 44
#>

################################################################################
# COMPUTE BORDERS
################################################################################
RO_bd <- obj.border(RO, nbs, silent = TRUE)

################################################################################
# COMPUTE SHARED BORDERS
################################################################################
RO_sbd <- obj.nbs(RO_bd, nbs, silent = TRUE)

# Convert row indices to cell numbers
RO_sbd1 <- RO_sbd[["1"]]
RO_sbd1 <- at$Cell[unlist(RO_sbd1)]

RO_sbd2 <- RO_sbd[["2"]]
RO_sbd2 <- at$Cell[unlist(RO_sbd2)]

# Borders in `RO_sbd` are identified by row indices
print(RO_sbd[["1"]]) # Row indices
#> $`2`
#> [1] 30 37
#>
print(RO_sbd1) # Cell numbers
#> [1] 31 38

print(RO_sbd[["2"]])  # Row indices
#> $`1`
#> [1] 29 36 43 44
#>
print(RO_sbd2) # Cell numbers
#> [1] 30 37 44 45

# Neighbor objects
names(RO_sbd[["1"]]) # RO1 has one neighbor, RO2
#> [1] "2"
names(RO_sbd[["2"]]) # RO2 has one neighbor, RO1
#> [1] "1"

################################################################################
# PLOT BORDERS
################################################################################
plot(cv.2.rast(r,at$cv), type="classes", col=c("#E6E600","#00A600"),
     main="Shared borders")
points(terra::xyFromCell(r, RO_sbd1), pch=20, col="blue")
points(terra::xyFromCell(r, RO_sbd2), pch=20, col="red")
text(xyFromCell(r, 11), "NA\nvalue")
